Zabbix: enterprise-scale monitoring without the license bill
Most monitoring tools work fine up to a certain host count, and then either the monitoring server collapses under its own weight or the license bill explodes. Zabbix is built specifically to avoid both: it’s designed from the ground up for large scale, and it’s completely free regardless of how many hosts you monitor.
The source lives at github.com/zabbix/zabbix , under GPLv2. The company behind it, Zabbix SIA (Latvia), doesn’t run a separate “enterprise edition” with features locked behind a paywall, everything is in the open source version, and revenue comes from support, training and certification. That’s a rare approach in the monitoring market, where “open source” usually means “the stripped-down version of the paid product”.
What Zabbix actually is
Zabbix has existed since 1998, created by Alexei Vladishev, and has gone through several architectural generations to reach its current form. Main components: the Zabbix server (the central engine, processes data and evaluates triggers), an optional Zabbix proxy (collects data locally in a segmented network and forwards it compressed to the server), agents (Zabbix Agent 2, rewritten in Go, active or passive) and a PHP frontend for administration and visualization. Historical data is stored in MySQL, PostgreSQL, or, for large volumes, PostgreSQL with the TimescaleDB extension.
The data model is simple once you see it: an item is a single collected metric (CPU load, free disk space, HTTP response time). A trigger is a logical expression over one or more items that flips a state between OK and Problem. An action defines what happens when a trigger fires: send a notification, run a remediation command, escalate after an interval if nobody acknowledges it. On top of all that sit templates: reusable bundles of items, triggers and graphs, attached to a host class (all Cisco switches, all MySQL servers) and inherited automatically.
Why this matters
Zabbix’s real differentiator is the proxy. When you have a segmented network, a remote site, an isolated VLAN, a secondary datacenter without direct connectivity to the central server, a Zabbix proxy runs locally, collects all the data there, and sends it compressed through a single tunnel to the server. The central server no longer has to open connections to thousands of individual agents; it only talks to proxies. That’s what allows scaling from a few dozen to tens of thousands of monitored devices without redesigning the architecture.
What you get out of the box
- Multiple collection channels: Zabbix Agent 2 (active or passive), SNMP, IPMI, JMX (through a Java gateway), an HTTP agent for webhooks and custom integrations, and calculated items derived from other items.
- Two-level auto-discovery: network discovery (scans an IP range and adds new hosts) and low-level discovery (LLD) for dynamic entities inside a host, filesystems, network interfaces, processes, that appear and disappear over time.
- A large template library, official and community-contributed, for operating systems, network gear from dozens of vendors, and common applications.
- Trigger dependencies, so you don’t get 50 “host down” alerts when what actually failed is a single upstream switch.
- Multi-step escalation actions, with resends and different channels depending on how long a problem has gone unacknowledged.
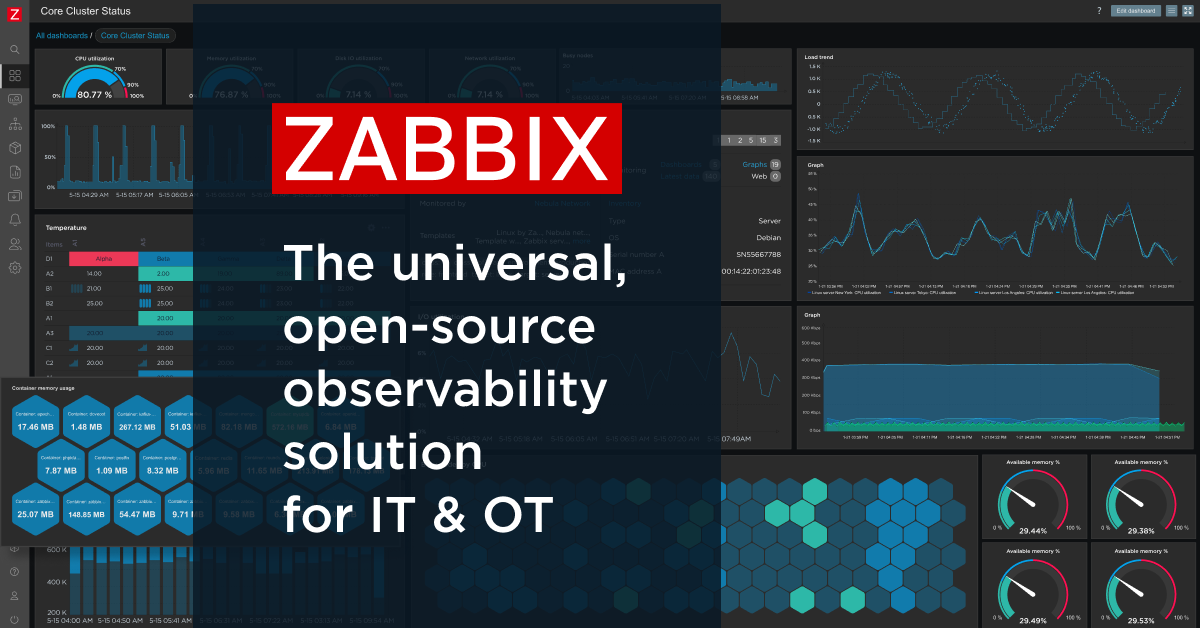
- Network maps for topology visualization and configurable widget-based dashboards.
- Distributed monitoring through proxies, for segmented networks or very large fleets.
Installing Zabbix on a VPS
The cleanest way to try Zabbix is through Docker Compose, with a PostgreSQL backend:
services:
  postgres:
    image: postgres:16-alpine
    environment:
      POSTGRES_USER: zabbix
      POSTGRES_PASSWORD: change_me
      POSTGRES_DB: zabbix
    volumes:
      - pgdata:/var/lib/postgresql/data

  zabbix-server:
    image: zabbix/zabbix-server-pgsql:6.4-alpine-latest
    environment:
      DB_SERVER_HOST: postgres
      POSTGRES_USER: zabbix
      POSTGRES_PASSWORD: change_me
    depends_on: [postgres]

  zabbix-web:
    image: zabbix/zabbix-web-nginx-pgsql:6.4-alpine-latest
    environment:
      DB_SERVER_HOST: postgres
      POSTGRES_USER: zabbix
      POSTGRES_PASSWORD: change_me
      ZBX_SERVER_HOST: zabbix-server
    ports:
      - "8080:8080"
    depends_on: [zabbix-server]

  zabbix-agent:
    image: zabbix/zabbix-agent2:6.4-alpine-latest
    environment:
      ZBX_HOSTNAME: vps-monitor
      ZBX_SERVER_HOST: zabbix-server

volumes:
  pgdata:
docker compose up -d starts the whole stack. The frontend is on port 8080, and the default login is Admin / zabbix, change it immediately.
For the firewall, with ufw, expose only what needs to be public (ideally nothing, put the frontend behind a reverse proxy):
ufw allow 22/tcp
ufw allow 80/tcp
ufw allow 443/tcp
ufw deny 8080/tcp
ufw deny 10050/tcp   # agent port, restricted to the Zabbix server IP only
ufw enable
Port 10050 (passive agent) should only be reachable from the Zabbix server’s or proxy’s IP, not the open internet, ufw allow from <server-ip> to any port 10050. A VPS
with 2 GB RAM comfortably runs the server plus frontend for a few hundred hosts; for thousands of hosts, add separate proxies.
Configuration patterns worth knowing
Proxies for segmented networks
If you have a branch office, an isolated VLAN, or a site without direct connectivity to the central server, a local Zabbix proxy solves it without a complicated VPN: the proxy collects everything locally and sends a single compressed stream to the server. It’s also easier on the firewall, one open port instead of hundreds of individual connections.
Low-level discovery for dynamic entities
Instead of manually configuring monitoring for every disk or network interface, LLD periodically scans the host and creates/removes items automatically based on what it finds. When you add a new disk to a server, LLD picks it up on the next run, with no configuration change on your part.
Trigger dependencies to cut the noise
When an access switch goes down, without dependencies configured you get an alert for every host behind it. With a dependency set (hosts depend on the switch’s availability), Zabbix suppresses the derived alerts and shows you a single real problem: the switch.
TimescaleDB for history compression at scale
If you’re storing data from thousands of items over the long term, plain PostgreSQL starts to struggle on space and query performance. The TimescaleDB extension, natively supported by Zabbix, automatically compresses older data and speeds up queries over large ranges.
Where Zabbix is not the right answer
For a homelab or 3-5 VPS instances, Zabbix is clearly overkill. The learning curve (items, triggers, actions, templates, proxies) doesn’t pay off for a small fleet; there, an Uptime Kuma or a Gatus do the job in a few minutes.
The UI is functional, but looks and feels “classic enterprise”, you don’t get the free-form exploration experience Grafana gives you over time-series data. Many teams use Zabbix as a data source, through the official Grafana plugin, precisely to combine Zabbix’s solid collection/alerting engine with modern visual exploration.
It’s also not ideal for ephemeral cloud-native workloads, where containers appear and disappear within seconds. Its discovery model assumes a host exists long enough to be discovered, configured and monitored; for environments where everything is ephemeral, a Prometheus-style model (pull with service discovery built into the orchestrator) fits more naturally.
Alternatives we considered
Checkmk offers a more automated discovery flow out of the gate and a stronger ITIL focus, in exchange for slightly less flexibility in the data model.
Prometheus/VictoriaMetrics + Grafana remain our choice for visual correlation and ad-hoc queries over metrics, we wrote about why we use them in a dedicated article.
Nagios/Icinga remain relevant for teams that want granular ground-up control, but without the native proxy-based scalability Zabbix has.
So, should you run it?
If you administer a large infrastructure, with lots of network gear, branch offices or segmented VLANs, and you want a mature, free system proven at enterprise scale, Zabbix is a solid choice. If your fleet is small, start with something simpler and come back to Zabbix when you grow.
You can start the test on a VPS with us in a few minutes using the stack above, or let our server administration team handle installation, proxies and templates from scratch.