WatchYourLAN: knowing what's actually connected to your network, right now
How many devices are actually connected to your network right now? Not how many you think there are, not how many show up in the diagram someone drew two years ago when the office got cabled, but how many actually answer an ARP scan this second. If you can’t answer that in under a minute, you have a visibility problem. A test laptop forgotten and left plugged in for six months, a switch someone “temporarily” added to get more ports, a cheap IoT gadget a colleague installed without telling anyone, all of that lives comfortably on your network until someone actually goes looking. The problem isn’t a lack of firewall rules or policy. The problem is you can’t defend what you don’t know exists.
That’s exactly what WatchYourLAN (github.com/aceberg/WatchYourLAN) is built for. It’s an open source project written in Go: it ARP-scans your subnet, remembers every host it finds, with MAC address, hostname, interface, and online/offline history, and puts all of it in a simple web UI, plus a /metrics endpoint for Prometheus. We run it ourselves, across our own network in our Bucharest datacenter: we run one instance per internal segment where we want direct visibility, and the results feed into our Grafana stack through that /metrics endpoint. We’re not selling it as a product, it’s an internal operational tool we’ve found useful enough to write about.
What WatchYourLAN actually is
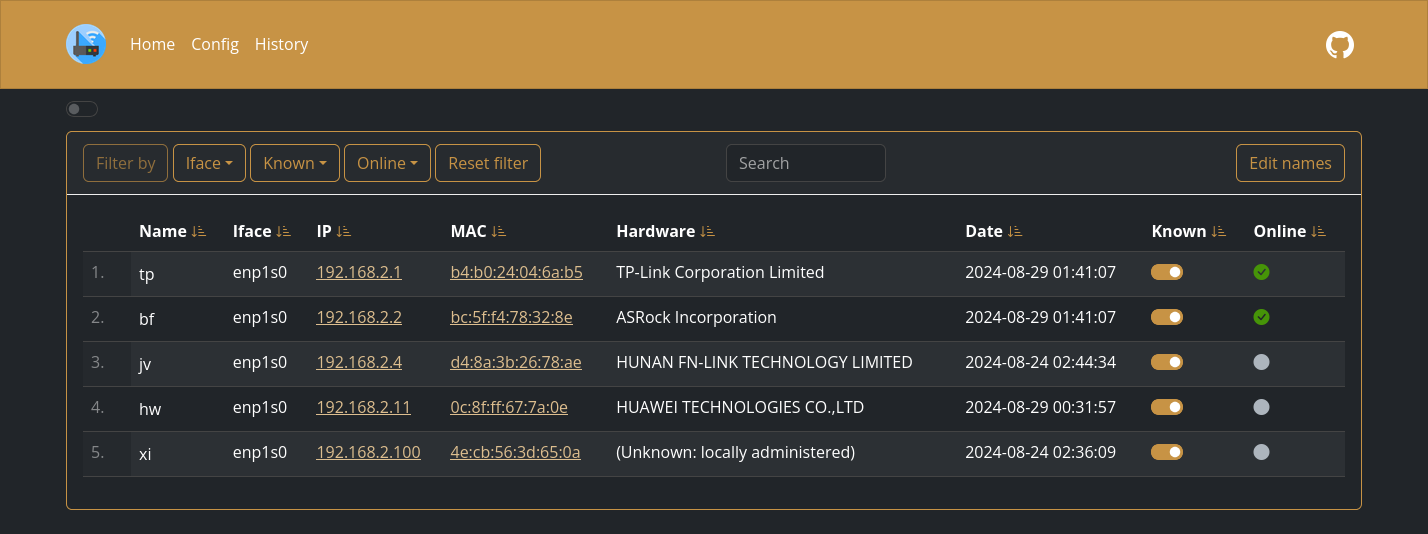
WatchYourLAN doesn’t do anything exotic, and that’s precisely its strength. It runs periodic ARP scans across one or more configured interfaces/subnets, and for every MAC address it finds, it records: the current IP, hostname (if it can be resolved), the interface it was seen on, online/offline status, and first-seen/last-seen timestamps. All of that gets written to a local SQLite database, so there’s no separate database server or heavy external dependency to run. Everything you see in the web UI, a list of hosts with IP, MAC, name, interface, and a known/unknown flag, comes straight out of that history.
On top of the UI, it exposes a /metrics endpoint in Prometheus format, which means you can scrape that data into whatever monitoring stack you already have, without writing the integration yourself from scratch. It’s written in Go, runs comfortably in a container, and is designed to work with host networking, because otherwise it has no way to actually see the real ARP traffic on the physical interface or VLAN you want to monitor.
Why it matters
A network inventory “on paper” (or in a spreadsheet last updated six months ago) lies to you constantly. Real network state changes daily: someone plugs in an unmanaged switch to add a few more ports, a test box stays powered on after the project ends, an IoT device shows up out of nowhere on the wrong VLAN. None of these show up in a quarterly audit, but all of them show up immediately in an ARP scan. WatchYourLAN answers “what’s actually alive on this segment right now, and since when,” which is exactly the kind of signal you want when you’re trying to spot unwanted equipment or simply confirm your network segmentation looks the way you think it does.
What you get out of the box
- A web UI listing every discovered host: IP address, MAC address, hostname/name, network interface it was seen on, and a known/unknown flag.
- Online/offline history per host, with first-seen and last-seen timestamps, so you can answer “since when has this thing been connected” without digging through logs.
- A Prometheus-compatible
/metricsendpoint, ready to scrape for dashboards and alerts in Grafana or anything else that speaks the Prometheus format. - Local storage in SQLite, no heavy external dependencies, easy to back up or reset.
- A lightweight Go binary that runs well in a container, typically with host networking so it can actually see real network traffic.
Installing WatchYourLAN on a VPS
The simplest way to try WatchYourLAN is in a container, with access to the interface you want to scan. A minimal docker run example:
docker run -d \
  --name watchyourlan \
  --network host \
  --restart unless-stopped \
  -e TZ=Europe/Bucharest \
  -e IFACES=eth0 \
  -v /docker/watchyourlan/data:/data \
  aceberg/watchyourlan:latest
Or, if you prefer docker compose:
services:
  watchyourlan:
    image: aceberg/watchyourlan:latest
    container_name: watchyourlan
    network_mode: host
    restart: unless-stopped
    environment:
      - TZ=Europe/Bucharest
      - IFACES=eth0
    volumes:
      - ./data:/data
The data volume holds the SQLite database, so keep it persistently mounted if you don’t want to lose host history on a container restart. The web UI runs on its own port, and if you expose that port outside the box, mind your ufw rules: don’t leave it open publicly without restriction. Either bind it to an internal address or a VPN only, or put it behind a reverse proxy with authentication, because a list of hosts, MAC addresses, and interfaces is effectively a map of your network topology, not something you want exposed to whoever happens to pass by.
One thing worth saying plainly: on a typical VPS, with a single network interface in a public cloud, WatchYourLAN has a narrower use case. ARP scanning only works within the same broadcast domain, and a standard VPS usually sits isolated from other tenants on the provider’s network, so it has nothing to “see” belonging to neighboring machines. Where it genuinely shines is on a segmented network, with VLANs or subnets you control, whether that’s internal infrastructure or a private network/VPC environment where host networking actually gives you access to real traffic. If you have a VPS with us and want to try the tool for a narrower use case (say, monitoring a private network reachable over a VPN into that VPS), you can start from our VPS page; for more complex topologies with multiple VLANs, our network page has more context.
Configuration patterns worth knowing
Scan interval
WatchYourLAN scans periodically, not continuously, and the interval between scans is a trade-off between “I see changes near real time” and “I’m not generating unnecessary ARP traffic on the network.” For a small or critical VLAN, where you want to catch a newly connected device quickly, a short interval makes sense. For a large segment with hundreds of hosts, a more relaxed interval avoids turning the scan itself into constant background noise. There’s no universally correct value, it depends on how often your network actually changes and how fast you want to know.
Known versus unknown
The known/unknown host flag is, in our opinion, the most practical feature of the whole UI. Once you’ve marked the hosts you expect (servers, workstations, network gear), any new appearance jumps out immediately as “unknown,” instead of getting lost in a long list of IPs. It’s worth making a habit of periodically going through the list and marking what’s legitimate, otherwise the “unknown” list itself becomes noise you learn to ignore.
Wiring /metrics into Prometheus and Grafana
Because WatchYourLAN exposes /metrics in Prometheus format, integrating it into an existing stack is straightforward: add a scrape job pointing at that endpoint, and from there you can build Grafana panels for online host counts per VLAN, new hosts that appeared in the last 24 hours, or alerts when a known, important host suddenly disappears from the network. That’s exactly what we do: our scan results land in Grafana alongside the rest of our infrastructure metrics, so we get one view, not a separate tab we forget is open.
One instance per VLAN/segment
If your network is segmented (and it probably should be), the cleanest model is running one WatchYourLAN instance per VLAN or subnet that matters, each with visibility limited to that interface/segment. That gives you both isolation (one broken or compromised instance doesn’t take down your visibility elsewhere) and clarity in the dashboard: you know exactly which VLAN is reporting what. That’s the approach we use internally too, one instance per segment that needs direct visibility.
Where WatchYourLAN is not the right answer
Let’s be honest: WatchYourLAN is not an IPAM. It doesn’t manage your IP allocations, doesn’t track reserved subnets or address planning, it just tells you what’s alive right now. For an authoritative source of truth on topology, allocations, and infrastructure documentation, a dedicated CMDB/IPAM tool (we use NetBox internally for that) is still necessary.
It’s also not a complete NAC (Network Access Control) or 802.1x solution. It tells you what it sees, but it doesn’t decide who’s allowed to connect and doesn’t block anything at the switch port level. If you need identity-based network access control, you need something alongside it, not instead of it.
It’s not a vulnerability scanner either. It tells you a host exists at an address, not what services are running on it or whether it has exploitable ports open. For that you need a dedicated, separate scanner.
And perhaps the most important technical detail: ARP scanning only works within the same broadcast domain. It can’t “see” past a router, so on a routed network with multiple separate subnets, you need an instance (or visibility) on each segment individually, not one magic instance covering everything.
Alternatives we considered
Before settling on WatchYourLAN for our use case, we looked at a few other options, some complementary, some direct competitors:
- nmap with custom scripts and a database behind it (often Postgres), for teams who want full control over scan format and what gets stored. Flexible, but you build all the persistence and UI yourself.
- arp-scan, the command-line tool that many other discovery tools conceptually build on. Great for one-off scans or custom scripting, but no persistent history or UI out of the box.
- Netdisco, an older project more focused on switch-level/topology discovery (including SNMP), useful when you want more than a plain ARP scan and also need switch port mapping.
- Fing, best known in its small/home network variant, focused on ease of use and mobile apps.
- Network discovery modules in Zabbix or PRTG, if you already run one of these monitoring systems in production and want discovery as an add-on feature rather than a separate tool to administer.
Each of these has its place. We picked WatchYourLAN for how easy it is to deploy per segment, and because /metrics plugs directly into our existing Grafana stack without adding another separate piece of software to manage.
So, should you run it?
If you run a segmented network and want to be able to answer “what’s connected here right now, and since when” at any moment, WatchYourLAN is a lightweight, free tool that’s honest about what it does: an ARP scanner with memory and a metrics endpoint, nothing more, nothing less. You can try it on one of our VPS instances if you want to play with it in an isolated environment, and if you want it properly wired into a segmented network with VLANs, with a discovery and monitoring workflow set up from scratch, our server administration team can handle the configuration and integration, so you’re not left with yet another tab you only check once a month.