Uptime Kuma: uptime monitoring without the headache
You don’t need an enterprise monitoring stack to find out your site went down before a customer does. You need something that periodically checks a URL, sends you a message when the response isn’t what you expect, and shows you a simple page with the uptime history. Uptime Kuma does exactly that, with an interface that looks better than most paid tools in its category.
The project lives at github.com/louislam/uptime-kuma , under the MIT license, created and maintained by Louis Lam. We run Gatus for our own status monitoring, because we prefer config-as-code, but Uptime Kuma is a very good alternative if you want an experience driven entirely from the web UI, without writing a single line of YAML.
What Uptime Kuma actually is
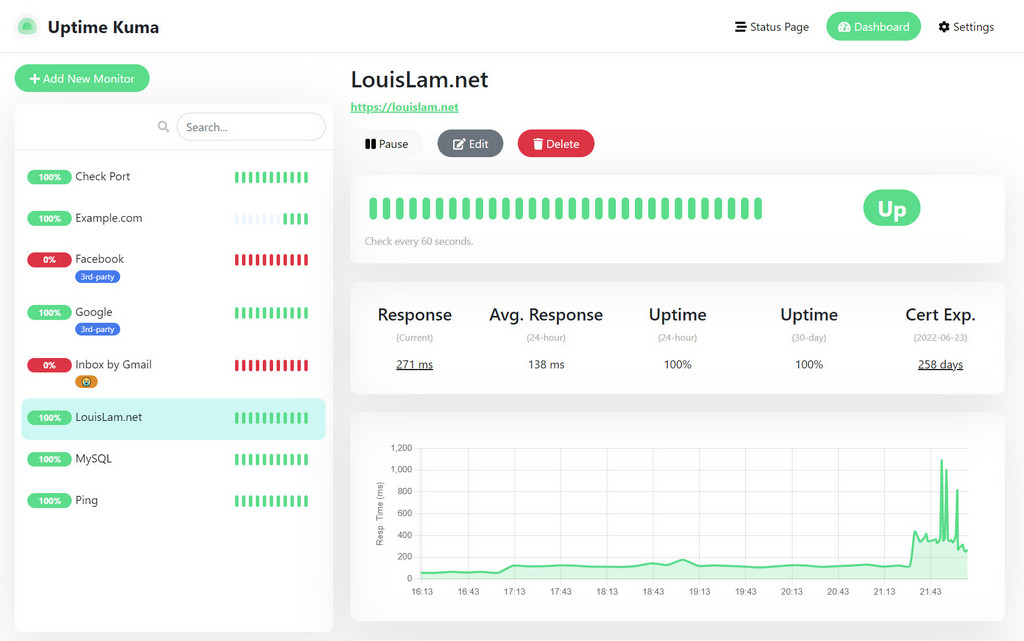
Uptime Kuma is essentially the self-hosted version of services like UptimeRobot or Pingdom: you add a monitor, choose what to check and how often, and the app shows you response time, uptime percentage, and sends you notifications when the state changes.
Technically, it’s a Node.js app, runs in a single container, and stores everything in SQLite, no separate database needed. The frontend is built in Vue and talks live to the backend via socket.io, so the dashboard updates in real time without a page refresh, which gives it the feel of a modern app rather than an old-school sysadmin tool.
The monitor types covered out of the box are surprisingly broad: HTTP(S) with status code or keyword checks on the response, TCP port, ping, DNS records, Docker containers (checked directly through the socket), gRPC, and push-type monitors, where an external job (a cron, a backup script) sends a “heartbeat” to Uptime Kuma instead of being polled by it.
Why this matters
For a solo developer or a small team, a monitoring stack you never fully configure helps nobody. Uptime Kuma gives you useful observability in five minutes: install it, add a few URLs, set up a Telegram notification, done. You don’t need templates, discovery, or complex triggers, just the answer to “is it up or not”.
What you get out of the box
- A reactive dashboard, with live websocket updates, no manual page refresh needed.
- Status pages, public or private, customizable, with support for multiple pages for different audiences (one public page for customers, one internal for the team).
- Over 90 notification integrations: Telegram, Slack, Discord, email, generic webhook, PagerDuty and many more.
- Multi-user support and 2FA for access to the instance.
- TLS certificate expiry monitoring, with alerts a few days before expiration.
- Maintenance windows, so you don’t get false alerts during planned maintenance.
- Simple configuration import/export and a basic API for custom integrations.
Installing Uptime Kuma on a VPS
A single container, with a volume for persistent data:
docker volume create uptime_kuma_data

docker run -d --name uptime-kuma \
  --restart unless-stopped \
  -p 3001:3001 \
  -v uptime_kuma_data:/app/data \
  louislam/uptime-kuma:1
On first access at http://<vps-ip>:3001, you’re asked to create the admin account. In production, put it behind a reverse proxy with TLS, Uptime Kuma doesn’t have its own certificate, and there’s no reason to expose port 3001 directly to the internet.
With ufw:
ufw allow 22/tcp
ufw allow 80/tcp
ufw allow 443/tcp
ufw deny 3001/tcp
ufw enable
Resource needs are minimal: the container runs comfortably on the smallest VPS we offer, even with a few dozen active monitors checking at one-minute intervals.
Configuration patterns worth knowing
Push monitors for internal jobs
Instead of waiting for Uptime Kuma to periodically check whether a cron job or backup script ran, you can set up a “push” monitor: the script itself sends an HTTP request to Uptime Kuma at the end of its run. If the request doesn’t arrive within the expected interval, the monitor flips to “down”. It’s the “dead man’s switch” technique, useful for jobs that run infrequently (daily backup, weekly sync) where classic polling doesn’t make sense.
Separate status pages per audience
You can create a simple public status page with only the services relevant to customers, and a separate, internal page with all the technical detail for the operations team. Both live on the same instance, but show different lists of monitors.
Retries and flapping resistance thresholds
Each monitor has a configurable number of consecutive failed checks before it triggers an alert (“retries”), plus a resend interval if the problem persists. Set correctly, it eliminates false alerts for a two-second network blip while still notifying you quickly about a real problem.
Docker monitor type for small self-hosted stacks
If you run a few containers on the same VPS, the Docker monitor type checks the container’s state directly through the Docker socket, without making an HTTP request to it, useful for internal services with no exposed port.
Where Uptime Kuma is not the right answer
All configuration lives in SQLite, managed through the web UI. If you want monitoring to be version-controlled in Git, reviewed through pull requests, and deployed identically across multiple environments, a config-as-code tool like Gatus fits better, we detailed that approach in our monitoring stack article .
It’s not a metrics platform: it gives you binary status (up/down) and latency, not detailed graphs of CPU, memory, or custom application metrics. For that you need VictoriaMetrics/Prometheus and Grafana.
Finally, it’s a single-node instance with no built-in replication. If your public status page runs on the same server that hosts the monitored services, an incident that takes down the server also takes down your monitor, exactly when you need to know what’s happening. For critical status pages, run the instance on infrastructure separate from what it monitors.
Alternatives we considered
Gatus is our preferred alternative for config-as-code monitoring: everything is defined in YAML, version-controlled in Git, with no hidden state in a database, a good fit for teams who want the entire monitoring configuration in one place, reviewable as code.
Checkmk or Zabbix are much heavier than you need for uptime monitoring alone, but worth considering if you end up also needing deeper infrastructure monitoring (CPU, memory, system services), not just external availability.
Statping-ng or Cachet are other, older status page options, but with notification and maintenance ecosystems less active than Uptime Kuma’s.
So, should you run it?
If you need a quick answer to “is my site up?” plus a presentable status page for customers, and you want everything ready to go in five minutes without writing any configuration, Uptime Kuma is the obvious choice. When you grow past a few dozen monitors or want Git-versioned configuration, consider Gatus or a heavier infrastructure tool.
You can spin up the container above on a VPS with us in a few minutes, or let our server administration team set up your monitoring and notifications from scratch.