SmokePing: seeing the jitter and packet loss a plain ping hides from you
A user complains that “the internet goes weird sometimes,” games lag, video calls stutter. You check the uptime dashboard: 100%, all green, ping responds fine. The problem is a plain up/down check only tells you whether a host answered at a given moment, not what latency looked like over time - a network can be “up” the entire time and still have high jitter or intermittent packet loss that makes any latency-sensitive application (VoIP, gaming, video conferencing) feel broken, without a single classic alert ever firing.
SmokePing (oss.oetiker.ch/smokeping ) is the tool built exactly for that gap, written by Tobi Oetiker, the same author behind RRDtool and MRTG - two tools half the network monitoring world uses without necessarily knowing who wrote them. GPL licensed, it’s a classic Perl tool that never tried to be anything other than very good at one job: measuring latency repeatedly, over time, and displaying it in a way that makes problems obvious at a glance.
What SmokePing actually is
SmokePing periodically sends probes (FPing by default, but it also supports DNS, HTTP(S), SSH, TCP and many other protocols through its pluggable probe system) toward a list of targets and measures the response time for each attempt. Rather than keeping only an average, it retains the full distribution of measurements within an interval, and the result is stored in RRDtool, the same round-robin database also used by MRTG.
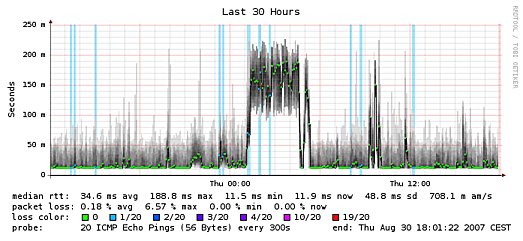
The project’s visual signature - where the name comes from - is the “smoke” graph: for each time bucket, instead of a single average-latency line, you see a grey band, thicker or more diffuse depending on how spread out the individual measurements were. A thin, constant band means stable latency. A thick, “smoky” band means high jitter - large variance between packets, exactly what a user experiences as “inconsistent lag.” Packet loss overlays on the same graph via color (from green to red), so you can see three things at once, at a glance: average latency, its variance, and the percentage of lost packets.
For larger networks, SmokePing supports a master/slave setup: a central server coordinates multiple geographically distributed measurement nodes, each reporting back to the master. Useful when you need to know not just “how far is X from me,” but “how far is X from several different points in the network.”
Why this matters
The difference from classic up/down monitoring is that SmokePing answers a different question. An uptime check tells you “the server responded at time X.” SmokePing tells you “how did the network path to the server behave over the last hour, week, month” - and that second question is the one that matters when you’re trying to figure out why a customer complains about a bad experience even though all your classic alerts are silent. Many real network problems (an intermittently saturated link, a switch starting to drop packets before it fully dies, an unstable peering session) show up in jitter and partial loss well before they become a full outage.
What you get out of the box
- A latency graph with a “smoke” band showing the full distribution of measurements, not just the average
- Visual overlay of packet loss via color coding, on the same graph
- Pluggable probes: FPing (default), DNS, HTTP(S), SSH, TCP, and many more through Perl modules
- RRDtool storage, so compact historical graphs with decreasing resolution as data ages
- Master/slave configuration for distributed measurements from multiple vantage points
- Configurable alerting on latency or packet-loss thresholds
- A web interface for interactive navigation through graphs and zooming into time ranges
Installing SmokePing on a VPS
SmokePing is a lightweight tool, well suited to a small dedicated monitoring VPS - in fact, a vantage point separate from the infrastructure you’re monitoring is ideal, so you see latency the way the outside world sees it, not only from inside your own network.
# on Debian/Ubuntu
apt update
apt install smokeping fping apache2

# enable the CGI module and the Apache config shipped with the package
a2enmod cgi
a2enconf smokeping-apache2
systemctl reload apache2

# targets to monitor are defined in /etc/smokeping/config.d/Targets
# minimal example to add under an existing section:
#   + MyServer
#   menu = My Server
#   title = Latency to production server
#   host = 203.0.113.10

systemctl restart smokeping
After install, the web interface is available by default at /smokeping under Apache, and the daemon starts accumulating data immediately - the first useful graphs appear after a few hours, but real trends (recurring jitter at certain hours, packet loss in a pattern) only become visible after a few days of collection.
# web interface (Apache), ideally restricted to your IP or a private network
ufw allow from <your_IP> to any port 443 proto tcp
# FPing needs the CAP_NET_RAW capability for ICMP, handled automatically
# by the Debian package - no extra open port required beyond this
If you’re using a master/slave setup, slave nodes need connectivity to the master on whatever port you configure for the RPC channel between them (typically an SSH tunnel or a dedicated channel, depending on how you set it up).
Configuration patterns worth knowing
Pick the right probe for what you actually want to measure
FPing measures network-level latency (ICMP), but if you want to know how long a service actually takes to respond (not just whether the host is “up”), use protocol-specific probes: DNS for a resolver, HTTP(S) for a site, SSH for a server you connect to frequently. A server can answer ICMP perfectly while the web service running on it has high latency for entirely different reasons.
RRDtool resolution decreases over time, by design
RRDtool keeps high-resolution data for recent periods and progressively aggregates older periods, so files don’t grow forever. That means if you want to investigate a specific event from three months ago at second-level granularity, you likely won’t have it - plan your alerting thresholds and archiving around that, don’t assume you have full history at maximum resolution indefinitely.
Use master/slave to tell “my problem” from “their problem”
With a single measurement point, you can’t know whether a latency spike is caused by your local network, an intermediate ISP, or the destination itself. With slave nodes in different locations (a different datacenter, a different ISP), you can correlate: if all nodes see the same problem at the same time, the cause is likely at the destination or a shared transit point; if only one node sees it, the problem is local to that vantage point.
Alerts deserve thought-out thresholds, not defaults
SmokePing can send alerts on latency and packet-loss thresholds, but the defaults know nothing about your specific network. 150ms latency can be entirely normal for an intercontinental link and alarming for a local one. Set thresholds per target, not globally.
Where SmokePing is not the right answer
SmokePing measures network-level latency and loss, but it doesn’t replace a full application or infrastructure monitoring system (CPU, memory, disk, processes). For that you need a separate stack (Prometheus/Grafana, Zabbix, Checkmk, or others), which SmokePing can complement, not replace.
Its interface is also functionally vintage: static, server-side-rendered RRDtool graphs, no modern interactive drag-and-drop dashboards. If you want cross-metric correlation in a single panel (latency + CPU + traffic on the same graph), you’ll need to export the data or pair it with another tool.
Finally, for very large networks with hundreds of targets, configuration through text files and a hierarchical menu structure can become unwieldy compared to modern solutions with automatic discovery.
Alternatives we considered
- Prometheus Blackbox Exporter + Grafana : a modern stack with flexible time-series storage and interactive dashboards, but it takes more pieces wired together to reach the same visual result
- MTR : combines traceroute with repeated per-hop latency measurements, excellent for point-in-time diagnosis, but not for continuous long-term monitoring
- Zabbix : a full monitoring platform that also includes ICMP latency measurements, with more sophisticated alerting, but a steeper learning curve and a much larger configuration surface
So, should you run it?
If you’ve ever needed to answer “was the connection really unstable yesterday between 2 and 4pm, or is the customer imagining it,” SmokePing is exactly the tool that gives you the answer, with visual proof at hand. It’s easy to install, light on resources, and its smoke graph remains, almost two decades after its debut, one of the clearest visual representations of jitter the open-source ecosystem has.
It runs comfortably on a small VPS , ideally placed outside the network you’re monitoring, so you see latency from a real user’s perspective. If you want to fold it into a broader monitoring strategy without handling server maintenance yourself, check out our server administration service or our network section for context on how these measurements tie into the rest of an infrastructure.