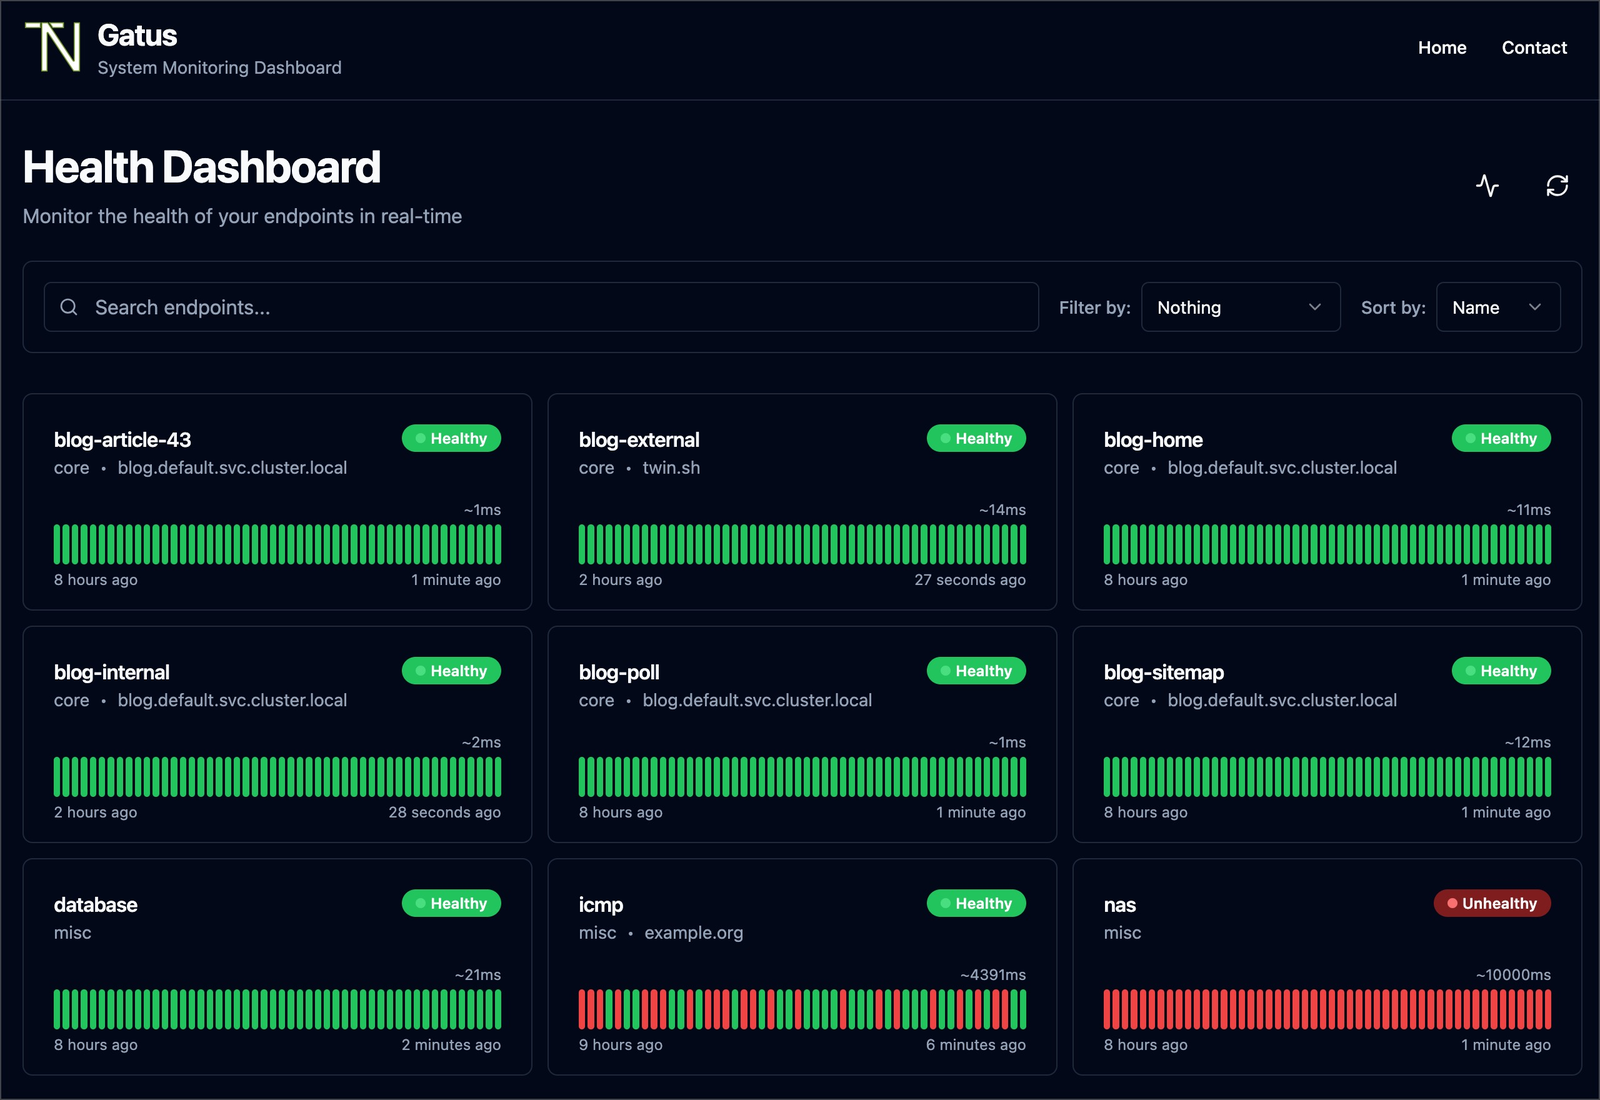
Gatus: health monitoring with config that lives in Git
A service goes down at 3 a.m. It doesn’t matter how clean the code is or how expensive the server is, something eventually breaks: a certificate expires, a database refuses connections, a container gets stuck in a crash loop. The only question that actually matters is how fast you find out, before a customer does, through an angry ticket at 9 a.m.
Our answer to that question is Gatus , a health-check and status page dashboard, open source, permissively licensed (MIT-style), written in Go, and shipped as a single lightweight binary or container image you can drop almost anywhere. This isn’t just something we recommend to others: we actually run it in our own datacenter in Bucharest, as an internal tool, to know instantly when something in our own infrastructure, or in a customer-facing service, goes down, before someone outside has to tell us.
What Gatus actually is
Gatus isn’t an agent you install on every machine to report system metrics. It’s not competing with a node exporter or a full-stack monitoring agent. It does one thing, and it does it well: it periodically checks a set of endpoints (HTTP, TCP, ICMP, DNS, TLS) and evaluates the response against conditions you write yourself, in YAML.
A condition looks like this: [STATUS]==200, [RESPONSE_TIME]<300, [CERTIFICATE_EXPIRATION]>168h. Easy to read, easy to write, and flexible enough to cover most real-world scenarios: “respond with 200 in under 300ms”, “the TLS certificate still has at least a week of validity”, “the port is open”, “the DNS record resolves correctly”.
Results are kept in SQLite, so you don’t need an external database just to hold the history, and Gatus also exposes a Prometheus-compatible /metrics endpoint, so you can wire it into an existing monitoring stack if you want to correlate the data with other metrics.
Why this actually matters in production
The real difference between this and “I put a ping in cron” comes down to two things: configurable failure/success thresholds, and built-in alerting integrations. You don’t want an alert on the first timeout (networks have blips), but you also don’t want to find out about a real outage 20 minutes later. Gatus lets you define exactly how many consecutive failures mean “this is actually down” and how many consecutive successes mean “this has actually recovered”, per endpoint. And once that threshold is hit, the alert goes out over email, Slack, Telegram, PagerDuty, or other supported channels, without you having to write your own debounce logic.
What you get out of the box
- A ready-to-use web status page showing the current state and recent history of every monitored endpoint.
- Multi-protocol checks: HTTP/HTTPS, TCP, ICMP (ping), DNS, and TLS/certificate validation, all from the same configuration format.
- Scriptable conditions on status code, response time, body content, certificate expiration, and other fields exposed by the response.
- Configurable failure-threshold and success-threshold, so you control alerting noise instead of it controlling you.
- Ready-made notification integrations for the most common channels (email, Slack, Telegram, PagerDuty, and others).
- A Prometheus-format
/metricsendpoint, for anyone who wants to feed the data into an existing stack. - Zero external database: history lives in SQLite, right next to the binary.
- Fully declarative configuration: everything you monitor is defined in YAML files, which means you can put the config in Git, review a pull request that adds a new endpoint, and have a complete change history for your monitoring, exactly like any other piece of infrastructure-as-code.
Installing Gatus on a VPS
The simplest way to try Gatus is with Docker, directly on a VPS. All you need is a configuration file mounted as a volume and one exposed port.
mkdir -p ~/gatus/config
cat > ~/gatus/config/config.yaml <<'EOF'
endpoints:
  - name: website
    url: "https://example.com"
    interval: 60s
    conditions:
      - "[STATUS] == 200"
      - "[RESPONSE_TIME] < 500"
      - "[CERTIFICATE_EXPIRATION] > 168h"

  - name: api-backend
    url: "tcp://example.com:5432"
    interval: 60s
    conditions:
      - "[CONNECTED] == true"
EOF

docker run -d \
  --name gatus \
  --restart unless-stopped \
  -p 8080:8080 \
  -v ~/gatus/config:/config \
  twinproduction/gatus
Or, if you prefer docker-compose, the equivalent is:
services:
  gatus:
    image: twinproduction/gatus
    container_name: gatus
    restart: unless-stopped
    ports:
      - "8080:8080"
    volumes:
      - ./config:/config
One thing worth keeping in mind from the start: if the VPS has ufw enabled (as any internet-facing server should), port 8080 isn’t opened automatically just because the container is running. Either explicitly open the port with ufw allow 8080/tcp (and restrict it to your own IPs if you can), or, better yet, put Gatus behind a reverse proxy with TLS and leave only 80/443 open, keeping 8080 reachable only from the server’s internal network. For a status page you and your team check, the second option is almost always the right call.
If you don’t already have a box to run this on, spin one up quickly on a VPS with enough resources for a small container, Gatus has no serious hardware requirements.
Configuration patterns worth knowing
Reasonable failure and success thresholds
Don’t set failure-threshold: 1 unless you genuinely want an alert on the first network blip. In practice, a threshold of 2-3 consecutive failures, at a 30-60 second check interval, gives you an honest signal without waking you up for every transient glitch. Symmetrically, a success-threshold of 2 confirms the recovery is real, not just one lucky response sandwiched between two outages.
Certificates that expire quietly
The condition [CERTIFICATE_EXPIRATION] > 168h (one week) on every HTTPS endpoint you monitor is probably the cheapest insurance you can configure. An expired certificate discovered by a customer before you is an unpleasant conversation that a single line of YAML avoids entirely.
Checks beyond HTTP
Not everything that matters answers on port 80/443. A database on TCP, a DNS record that needs to resolve to the right IP, an ICMP ping to a network device, a TLS certificate on a non-web port, all of these fit into the same list of endpoints, with the same kind of conditions. In practice, a single tool covers both your web application and the infrastructure behind it.
Alert by group, not per individual endpoint
Once you have dozens of endpoints, per-service alerting can become noise in its own right. Group endpoints logically (public-facing, internal, database, network) and think about the right notification channel for each group: a Slack channel for “worth watching” alerts, PagerDuty or direct email for the ones that genuinely need immediate action.
Where Gatus is not the right answer
Gatus is excellent at one thing: “is this endpoint available and responding the way I expect?”. Don’t try to use it as a substitute for a full observability stack. It doesn’t do distributed tracing, it won’t tell you why latency spiked on a specific database query, it doesn’t profile your application, and it doesn’t replace a centralized logging system. If you need to understand an application’s internal behavior, not just whether it responds from the outside, you need application metrics, structured logs, and probably tracing, alongside Gatus, not instead of it.
Also, if your team already has a mature Prometheus/Grafana stack with blackbox checks configured, you might not gain much by bolting on Gatus separately, beyond a dedicated status page that’s easier to show to people who don’t read PromQL dashboards.
Alternatives we considered
- Uptime Kuma : probably the best-known alternative, with a web interface much more oriented toward click-and-configure. If you’d rather add monitors from a UI than from version-controlled YAML files, Uptime Kuma is a solid choice. The trade-off is that configuration history lives in the application’s own database, not in Git, which makes code review and change tracking harder.
- Prometheus Blackbox Exporter : if you already run Prometheus and just want probe-style checks (HTTP, TCP, ICMP, DNS) integrated directly into that ecosystem, without a separate status page, blackbox exporter does exactly that, but it stays one more piece inside a Prometheus stack rather than a standalone product with its own UI.
- Healthchecks.io : a different angle, focused on monitoring cron jobs and scheduled tasks (a “dead man’s switch”: if the job doesn’t check in on time, you get alerted), rather than active endpoint checks. It can be self-hosted, and pairs well with Gatus as a complement, not necessarily a replacement.
The reason we picked Gatus was simple: config-as-YAML-in-Git matches exactly how we treat the rest of our infrastructure, as infrastructure-as-code, reviewed in pull requests, not quietly edited from a UI that doesn’t remember who changed what.
So, should you run it?
If you’re a small team or a solo developer who wants to be the first to know, not the last, when something breaks, Gatus is a solid choice: easy to install, easy to understand, and its configuration lives next to the rest of your code, not in a separate database. It’s not a substitute for full observability, but for the basic question, “is this service actually up right now”, it gets the job done without unnecessary complexity.
If you need a place to run it without the hassle, a VPS is more than enough for a dashboard like this, and if you’d rather not deal with the server administration side yourself, firewall setup, updates, hardening, our server administration team can take over the operational part while you focus on what the dashboard shows.