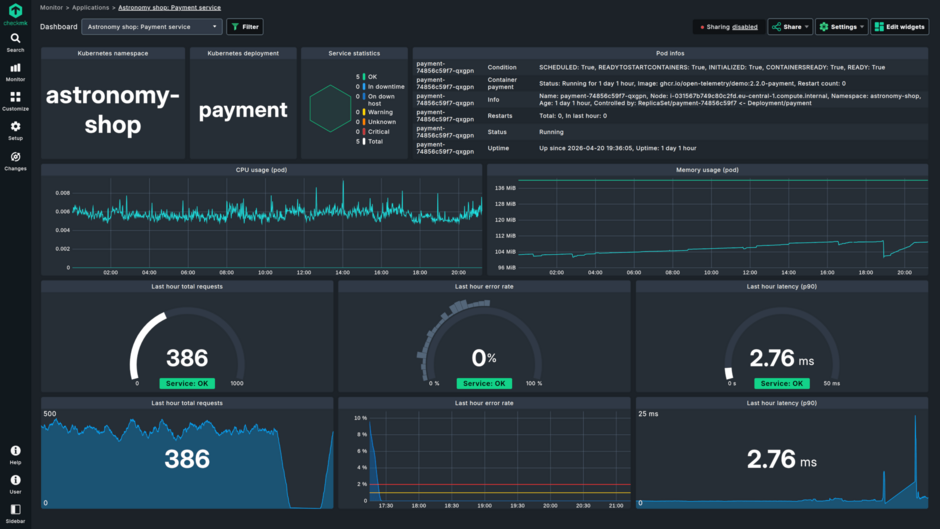
Checkmk: infrastructure monitoring that configures itself
A sysadmin who hand-maintains monitoring config for 150 servers eventually ends up in one of two states: either they ignore half the alerts because they’re noise, or they hear about a problem from a customer before it shows up on the dashboard. Both are symptoms of the same disease: someone had to write every check, for every host, by hand, and nobody kept up as the infrastructure grew.
Checkmk attacks exactly that problem. Instead of starting from a blank slate and manually declaring “monitor the /var filesystem on host X”, you point it at a host and it tells you what it found: filesystems, network interfaces, processes, systemd units, Docker containers, whatever is there. The code lives at github.com/Checkmk/checkmk , the Raw edition is open source under GPLv2, and we run it in production ourselves, alongside Grafana and VictoriaMetrics, for service auto-discovery and classic host monitoring in our Bucharest datacenter.
What Checkmk actually is
Checkmk started around 2008 as a plugin called check_mk for Nagios, built to solve the pain of manually configuring checks. Over time the project grew into a full monitoring platform with its own collection engine and its own web interface, but it kept the original philosophy: discover first, configure second.
In practice it works like this: you install the Checkmk agent on a host (a small binary, no heavy dependencies) or configure it to talk SNMP/IPMI/HTTP to a device that can’t run an agent. Then you run discovery, and Checkmk proposes a list of services to monitor based on what it actually found there. You accept the list (or tweak it), and from that point on the host is monitored.
There are two major edition tracks: Raw, fully open source, with a check engine historically based on Nagios-core, and the commercial Enterprise/Cloud editions, which bring a proprietary core (CMC), higher scale, reporting, and a few extra integrations (agent bakery, for example). For most self-hosted infrastructures, Raw is enough.
Why this matters
The difference versus classic Nagios or Zabbix isn’t philosophical, it’s practical: time. With 5 servers you write the config by hand and never notice the cost. With 50 or 500, every new host, every new disk, every reconfigured network interface means a manual edit that someone eventually forgets. Checkmk removes most of that repetitive work: you run discovery periodically, and the differences (new services that appeared, services that vanished) are flagged explicitly, not silently ignored.
What you get out of the box
- Auto-discovery of hosts and services, backed by over 2000 bundled check plugins covering operating systems, network gear from dozens of vendors, databases, hypervisors and common applications.
- Hybrid collection: agent-based wherever you can install a binary, agentless via SNMP, HTTP/API or IPMI wherever you can’t (switches, UPS units, BMCs).
- Rule-based notifications, with flexible routing to email, Slack, an SMS gateway or any custom script, depending on host, severity, or time of day.
- Downtimes and acknowledgements, plus an ITIL-style workflow for problem states (open, acknowledged, closed) and an event console for correlating syslog/SNMP traps.
- Hardware/software inventory, with change history, useful when you need to know what changed on a server between two incidents.
- Built-in graphs and dashboards based on RRD, plus a business intelligence feature that rolls up the state of multiple services into a single “is this business service OK or not” view.
Installing Checkmk on a VPS
The easiest way to try Checkmk is the official Docker image, which bundles a complete “site” (agent, core, UI, RRD store) into a single container:
docker volume create checkmk_data

docker run -d --name checkmk \
  --restart unless-stopped \
  -p 8080:5000 \
  -v checkmk_data:/omd/sites \
  --tmpfs /opt/omd/sites/cmk/tmp:exec \
  checkmk/check-mk-raw:2.3.0-latest
On first start, the container generates an admin password for the cmk site and prints it to the log (docker logs checkmk). The UI is available at http://<vps-ip>:8080/cmk/check_mk/, but in production you put it behind a reverse proxy with TLS (Traefik, nginx, Caddy), you don’t expose it directly.
For the firewall, with ufw:
ufw allow 22/tcp
ufw allow 80/tcp
ufw allow 443/tcp
ufw deny 8080/tcp
ufw enable
The idea is that port 8080 (or whatever internal app port) is only reachable from localhost/reverse proxy, not directly from the internet. For a small-to-medium fleet, a VPS with 2-4 GB RAM is enough for discovery and monitoring up to a few dozen hosts; beyond that, allocate more memory or consider multiple distributed Checkmk sites.
Configuration patterns worth knowing
Discovery per folder, not per host
Checkmk organizes hosts into folders, and rules (what to monitor, how to notify, what thresholds to use) can be attached at the folder level, inherited by every host in it. Instead of configuring each server individually, you group similar hosts (all web servers, all Cisco switches) into a folder and apply rules once. Discovery runs periodically per folder, and differences from the known state show up as “new/vanished services to review”, not applied silently in the background.
Piggyback data for indirect architectures
A useful technique when you have a machine (a hypervisor, a load balancer) that “knows” more about other hosts than they can learn on their own: Checkmk lets one host push monitoring data on behalf of another host (“piggyback”). A hypervisor can report VM state without each VM needing its own agent installed. The pattern is similar to how we auto-derive Prometheus/VictoriaMetrics scrape targets from our Ansible inventory: the source of truth stays in one place, and everything else is derived from it.
Event console for correlating syslog and SNMP traps
If you’re already receiving syslog or SNMP traps from network gear, Checkmk’s event console can ingest and correlate them with existing hosts, turning a raw log stream into a structured monitoring signal, with matching rules and escalation.
Layered notification rules
Notification rules can chain: a general rule for the whole infrastructure, overridden by specific rules for a group of critical hosts (production databases, for example) that go through a different channel with a different severity threshold. Avoid having a single Slack channel receiving everything, from a disk at 80% to a downed server.
Where Checkmk is not the right answer
If what you want is a correlated, ad-hoc view over high-cardinality metrics (per-request, per-container, per-API-endpoint), Checkmk is not the right tool; that’s where Prometheus or VictoriaMetrics, queried through PromQL and visualized in Grafana, are far more flexible. We wrote about Grafana as a visualization layer in an earlier article.
It’s not a log aggregator either: Checkmk’s log monitoring is useful for simple pattern matching (search for a string, count occurrences), not full-text search over terabytes of logs, where you need Loki or ELK.
Finally, the Raw edition has real limits versus Enterprise: agent bakery (custom agent packaging per host group) and scaling past a few thousand hosts are why larger teams pay for the commercial edition. For a small-to-medium self-hosted fleet, though, Raw comfortably covers the need.
Alternatives we considered
Zabbix is the most direct alternative: equally mature, equally open source, but with a different organizational model (items/triggers/actions instead of automatic service discovery) and a stronger focus on scaling through distributed proxies.
Prometheus/VictoriaMetrics + Grafana remain our choice for time-series metrics and custom dashboards, we detailed why we picked that combo separately. Checkmk and this combo aren’t mutually exclusive: many teams run them side by side, Checkmk for discovery + alerting + ITIL workflow, Grafana for visual correlation and exploration.
Nagios, the direct ancestor, remains a valid option if you want full ground-up control, but the manual maintenance cost is exactly what Checkmk is trying to eliminate.
So, should you run it?
If you administer infrastructure with dozens or hundreds of heterogeneous hosts and network devices, and you want to stop hand-writing monitoring configs for each one, Checkmk is worth installing at least as a weekend proof of concept. Discovery alone, showing you within minutes what services run on a new host, justifies the time invested.
If you want to try it without dealing with installation and maintenance, get a VPS with us and spin up the container above in a few minutes, or let us handle all of it through our server administration service , from install to tuning the notification rules.