Akvorado: see who is actually sending you traffic, flow by flow
The question that haunts every network operator is simple and hard to answer: who is actually sending me all this traffic? The counter on your uplink tells you 8 Gbps are coming in, but it does not tell you that half of it comes from a single AS you could peer with directly and cut your transit bill. Without flow visibility, peering and capacity decisions are informed guessing. With it, they are arithmetic.
Akvorado , the open-source flow collector built and run in production by Free (a large French ISP), exists for exactly that question. It is licensed under AGPLv3, has more than 2,300 stars on GitHub, and we run it on our own network, in our Bucharest datacenter, in front of AS57050 and our DSIX exchange. This post is the field report.
What Akvorado actually is
Akvorado is a network flow collector, enricher and visualizer. Your routers and switches export metadata about traffic (who talks to whom, on which ports, how much) via standard protocols: NetFlow, IPFIX and sFlow. Akvorado receives them, adds context, stores them in a database optimized for aggregation, and gives you a web console where you answer questions about your traffic in seconds.
The “enrichment” part is what turns a raw flow into useful information. A flow record says “IP X sent 4 GB to IP Y on interface 12”. Not very useful. Akvorado adds:
- Interface names via SNMP: interface 12 becomes “transit: telia” or “peering: franceix”, with description and speed, by querying the router over SNMP.
- Geo and ASN: IP X becomes “AS2906 Netflix” with a country, using GeoIP databases (IPinfo).
- BGP context: AS-path, communities, boundary type (internal vs external).
Out of an anonymous flow comes a readable sentence: “AS2906 Netflix sent me 4.7 Gbps through the telia transit, exiting on th2-edge1”. Exactly the kind of sentence you use to make decisions.
How it is built underneath
Akvorado is not a single binary, it is a small scale-oriented architecture, and it is worth understanding in three pieces:
- Inlet: the process that listens for flow packets (UDP) and decodes them. This is where sFlow and NetFlow from routers land.
- Orchestrator: the configuration brain, it manages the ClickHouse schema and Kafka topics, and serves configuration to the other components.
- Console: the web interface, where you, the human, ask questions and see graphs.
Behind the scenes, flows pass through a Kafka (a buffer that absorbs bursts) and land in ClickHouse, the columnar database that can aggregate billions of flow rows in milliseconds. That choice is the key: a flow analyzer lives or dies on how fast it answers “sum all my traffic over the last 24 hours, grouped by source AS”. ClickHouse is monstrously good at exactly that.
What you see in the console
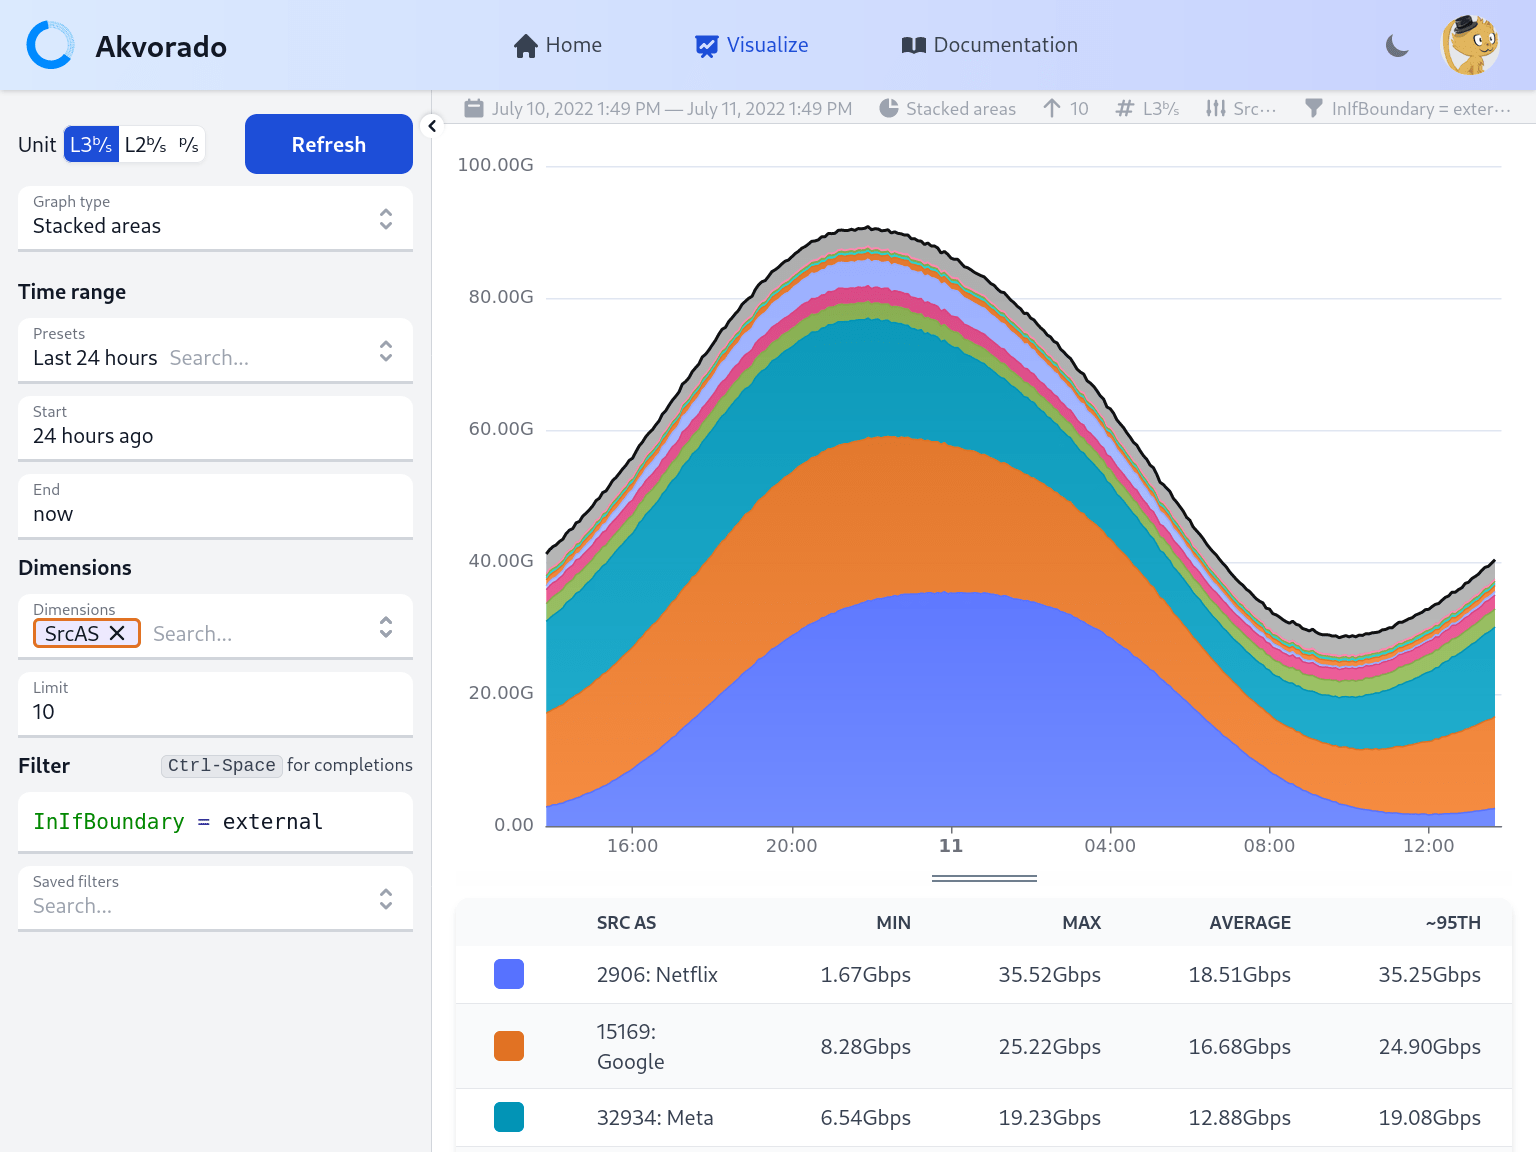
The console is where Akvorado shines. You pick a few dimensions (source AS, exporter name, inbound provider, country, port) and a filter in a simple language (InIfBoundary = external), and Akvorado draws you:
- A Sankey diagram: columns left to right showing how traffic flows, from the source AS, through the connection type (transit / peering / ix), through the concrete provider (telia, cogent, franceix), to the edge router. At a glance you see what proportion of traffic comes from where and by which path it exits. It is the best picture for peering decisions you will ever see.
- Time series: the same traffic drawn over time, so you see peaks, day/night patterns and events.
- A table: the exact numbers, sortable, behind the graphs.
For an ISP or a LIR, this answers questions worth real money: “how much transit would I save if I peered directly with this AS?”, “who are my top 10 talkers?”, “is that weird 3 AM traffic a legitimate backup or the start of an attack?”.
Installing Akvorado
Akvorado is not a one-line service, precisely because it brings ClickHouse, Kafka and Redis with it. The good news: the official repo ships a complete docker compose that brings the whole stack up with one command. Clone, configure, bring up:
git clone https://github.com/akvorado/akvorado
cd akvorado/docker
cp ../config/akvorado.yaml akvorado.yaml
docker compose up -d
The compose starts ClickHouse, Kafka, Redis, plus the three Akvorado components. The console becomes available on the configured port (via the proxy in the compose by default), and the public demo at demo.akvorado.net shows you exactly what it looks like with real data, before you invest in your own setup.
The important step once it is up: tell your routers to export flows to Akvorado. On a router you configure sFlow or NetFlow toward the inlet’s IP and port. In our case, the edge routers send sFlow to Akvorado on a dedicated port, separate from the rest of our telemetry pipeline, so they do not step on each other.
As with any management console, do not expose it publicly without an authentication layer, because it reveals your network’s topology and traffic patterns. We put it behind our SSO; you, at minimum, restrict it with a firewall:
ufw allow from YOUR_OFFICE_IP to any port 8080 proto tcp
ufw deny 8080
The flow ingestion port (UDP), on the other hand, must be open toward your routers, and only toward them, so nobody can send you bogus flows.
If you are running this on a DreamServer VPS , ClickHouse will want some disk and RAM, so size it for the retention you want.
Configuration patterns worth knowing
A few things useful beyond the defaults.
Interface descriptions are everything
The power of the Sankey lives in the interface names. If your routers have clearly described interfaces (transit: X, peering: Y, ix: DSIX), Akvorado picks them up via SNMP and the graphs become instantly readable. Invest ten minutes in good descriptions on your routers and you gain months of clear reports.
Use it for peering decisions
The most valuable report you can pull: group by source AS, filter to traffic coming in via transit (not via existing peering), and sort descending. The top ASes in the list are your peering candidates, the ones where, if you connect directly at an exchange like DSIX, you move volume off paid transit onto free peering.
Retention costs disk
ClickHouse compresses excellently, but high-resolution flows over the long term still take space. Keep fine resolution short-term (the last few weeks) and aggregates long-term. Akvorado supports multi-resolution tables for exactly this.
Separate ingestion from the rest of your telemetry
If you already have an sFlow collector for something else (in our case DDoS protection), run Akvorado on a different ingestion port. A router can export the same flow to multiple collectors at once, each with its own purpose.
Where Akvorado is not the right answer
It is worth being honest about the limits.
- Not health monitoring. Akvorado tells you about traffic, not the router’s CPU, temperature or a link’s state. For that you need classic SNMP and a Grafana on top.
- Not packet capture. Flows are sampled and aggregated; you see “AS2906 sent me 4 GB”, not packet contents. For packet-level forensics you need a different tool.
- Requires hardware that exports flows. If your routers do not support NetFlow/IPFIX/sFlow, Akvorado has nothing to collect.
- ClickHouse + Kafka are not “lightweight”. It is a real stack, not a binary. On a small network it runs comfortably, but you treat it as infrastructure, with backups and tuning, not as a container you throw and forget.
Alternatives we considered
For completeness: we also looked at ntopng (excellent for real-time visibility and deep packet inspection, but less oriented toward historical analysis at scale), pmacct (the classic, extremely flexible collection engine, but no UI, you build the visualization), and Elastiflow on the Elastic stack (capable, but heavier and with commercial parts). For an ISP that specifically wants peering and traffic analysis with readable Sankey diagrams, Akvorado is the most on-target.
So, should you run it?
If you operate a network with transit and peering, or even just a router that traffic you want to understand passes through, Akvorado is worth the setup weekend. The first time you pull a Sankey and see in black and white that 40% of your paid transit comes from three ASes you could peer with for free at a local exchange, you will know it has earned a permanent place in your stack.
We run Akvorado in front of the AS57050 network, fed by our edge routers, and use it exactly for peering decisions at DSIX , our Bucharest exchange. If you want to try it on infrastructure you do not have to build first, our VPS plans are large enough to run a test ClickHouse, and our server administration service covers the install and tuning if you would rather skip the learning curve.
Either way, finally seeing who sends you your traffic is a revelation the bytes graph on your uplink will never give you. The code is on GitHub, there is a public demo you can touch right now, and you will know within an hour whether it earns a spot in front of your network.